Before beginning this project Mr. Sillman will go over the basic functions and vocabulary of Microsoft Excel. Please refer to the Excel reference post for help or review.
TP – Students will collect, manipulate , and calculate data using Microsoft Excel
Follow these instructions:
This project will use both Excel and Word to gather, manipulate, and process data about fast food.
1. Pick a fast food restaurant chain.
2. Choose four items from the menu – It must include an entree (burger, salad, chicken), a side (fries, mashed potatoes, chili), a drink (soda, milk, juice), and a desert (ice cream, pie, cookie).
3. Find the Calories and the Calories from Fat for each item.
I suggest you look up the- (Restaurant name) nutrition facts PDF
If not, these sites might help:
http://menustat.org/advanced-search/
http://www.fastfoodnutrition.org/
http://nutrition.mcdonalds.com/getnutrition/nutritionfacts.pdf
4. To help you set up the spreadsheet click the link above. Click on the SAMPLE SPREADSHEET link under the word food.
YOU WILL FIND THESE INSTRUCTIONS:
Sample Spreadsheet

Entering Data and Formulas:
Set up your Excel spreadsheet like the one above. You will enter the calories in column B and fat calories in column C.
To figure out non-fat calories, write a formula to subtract the fat calories from the total calories. (HINT: =B2-C2)
To figure out the percentage of calories from fat, divide fat calories by calories. Format the cells in column E for percentage. (HINT: =C2/B2)
To figure out total calories, total fat calories, and total non-fat calories, you can use the AutoSum button or write a formula. To figure out the total percentage of fat, divide total calories by total fat calories.
5. Enter that data into the spreadsheet you have created.
6. Create math formulas to find the rest of data (I will help).
7. At the bottom of the SAMPLE SPREADSHEET page click the link for Charts.
Sample Charts
You’ll be making three charts to go along with your spreadsheet. Save them as part of your spreadsheet. When you finish the spreadsheet and chart, answer the questions on the handout. Then return to theproject homepage to complete the final step.
 |
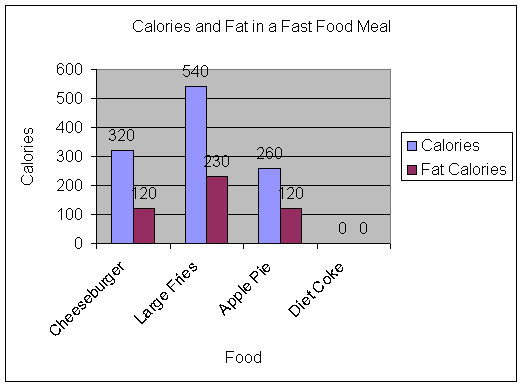
Create this column chart by selecting the data in columns A, B, and C. I didn’t include the total calories for my meal, but you can if you want. Don’t forget to give it a title and to label your axes. |
 |
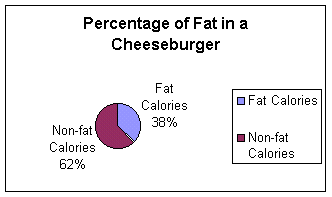
Create this chart by selecting the fat/non-fat calories for one of the items on your menu. You’ll need to select the labels in cells C1 and D1 and then the calories. Don’t forget to hold down the Control key to select data that isn’t right beside each other. Be sure to label your data and include the percentages. Don’t forget a title! |
 |
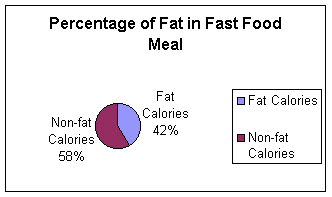
Create this chart by selecting your total fat and non-fat calories for the meal found in cells C6 and D6. You’ll need to select the labels in cells C1 and D1 and then the calories. Don’t forge to hold down the Control key to select data that isn’t right beside each other. Be sure to label your data and include the percentages. Don’t forget a title! |
8. Follow the directions on the charts to create a bar graph and a pie chart.
9. You will then have a writing piece which will make you think about the following questions:
After looking at these numbers, do you think this is a healthy meal? How could you make it better for you?

Here is the rubric to help you out:


